IN THIS SECTION
Board Report: 2015-MO-B-006 March 31, 2015
The Board Can Enhance Its Diversity and Inclusion Efforts
available formats
-
Executive Summary:
PDF | HTML -
Full Report:
PDF (7 MB) | HTML - Accessible version
Employee Surveys
According to GAO, involving employees in diversity management efforts helps drive diversity throughout an organization. Employee surveys provide an opportunity for employees to share with management their perceptions of the agency's diversity and inclusion, culture, and work environment.60
This section presents information on the Board's efforts to obtain employee feedback. Specifically, we provide the Board's practices on satisfaction and exit surveys as well as demographic information regarding separations from the Board during the 2011–2013 period.
The Board's Process
The Board did not conduct agency-wide employee satisfaction surveys during the 2011–2013 period. On September 4, 2014, an external consulting firm administered the Board's first agency-wide engagement survey. Eighty-seven percent, or 2,147 employees, responded to the survey in its entirety. The survey included the three questions below, which were designed to gather data specifically related to employee perceptions of diversity and inclusion. Employees were asked to rate their responses as strongly agree, agree, neutral, disagree, or strongly disagree. As detailed below, 64 percent to 75 percent of respondents answered either or strongly agree or agree to the three questions.
| Diversity and inclusion question | % responding strongly agree or agree |
|
My organization's policies promote fair treatment of employees regardless of their different diversity characteristics. |
75 |
|
My organization values employees with varied backgrounds and experiences. |
67 |
|
My organization is committed to promoting diversity and inclusion. |
64 |
The Board is continuing to assess the results of the 2014 survey and will determine what, if any, action plans are needed. These action plans will help to determine the timing of the next survey. We were also informed that the Board may consider conducting a diversity and inclusion survey once the agency-wide survey results have been thoroughly analyzed. These efforts will allow for trend analyses on the success of diversity initiatives as well as workplace inclusion.
We also noted that in 2013, two divisions independently conducted employee satisfaction surveys to obtain their employees' perspective on the particular division's work environment. Each survey contained one question specifically related to diversity and inclusion.
Although the Board did not conduct an agency-wide employee satisfaction survey in 2011, 2012, or 2013, ER offered separating employees the opportunity to voluntarily complete an electronic exit survey and participate in a face-to-face exit interview. ER collected the data and interview responses and prepared aggregate separation information for reporting in the HR section's internal annual report.
Demographic Statistics
Separations
We reviewed data for employees leaving the Board. Generally, the rate at which employees left Board employment was consistent with federal executive agencies during 2011–2013 (figure 8).61
Figure 8: Separations (Including Retirements) From the Board and the Federal Government Average, as a Percentage of the Workforce, 2011–2013a
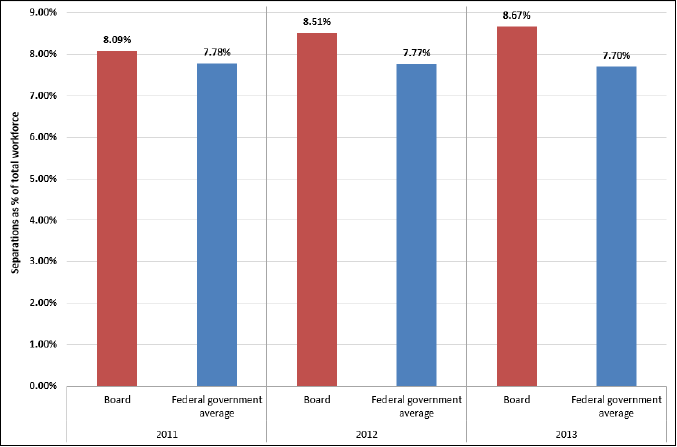
Source: OIG analysis of Board-provided data and OPM's FedScope data.
aOPM's FedScope data, which we used as a benchmark, are recorded on a fiscal-year basis; however, Board separation data are captured on a calendar-year basis rather than a fiscal-year basis. Both FedScope and Board separation data include retirements. Return to figure
We analyzed the demographics of employees leaving Board service for reasons other than retirement. In 2011, 117 Board employees, or approximately 5 percent of the workforce, separated for reasons other than retirement. In 2012 and 2013, there were 139 and 138 nonretirement separations, respectively, accounting for approximately 6 percent of the workforce in both years.
Research assistants are considered permanent employees during their two-year tenure at the Board. Excluding research assistant separations, the Board's annual separation rate decreases by an average of 1.71 percent over the three years.
From 2011 through 2013, the number and percentage of female employees leaving Board service for reasons other than retirement remained relatively steady. Fifty-three female employees left the Board in 2011 and again in 2012, and 49 female employees left the Board in 2013. These separations represented 4.68 percent to 5.34 percent of the total female workforce.
With respect to race/ethnicity:
- In 2011, 12 Black/African American employees separated; in 2012, 20 Black/African American employees separated; and in 2013, 12 Black/African American employees separated. These separations represented 2.09 percent to 3.49 percent of the Black/African American workforce.
- In 2011, 16 Asian employees separated; in 2012, 13 Asian employees separated; and in 2013, 14 Asian employees separated. These separations represented 4.39 percent to 6.13 percent of the Asian workforce.
- In 2011, 4 Hispanic/Latino employees separated; in 2012, 5 Hispanic/Latino employees separated; and in 2013, 9 Hispanic/Latino employees separated. These separations represented 4.65 percent to 9.38 percent of the Hispanic/Latino workforce.
- In 2011, 83 White employees separated; in 2012, 98 White employees separated; and in 2013, 99 White employees separated. These separations represented 6.72 percent to 7.63 percent of the total White workforce.
Additional information on nonretirement separations by sex, race/ethnicity, and age can be found in appendix H.
The Board Has Begun Providing Employee Exit Survey Statistics to Divisions
Employees who separated from the Board are given the opportunity to voluntarily complete an exit survey and, separately, to participate in an exit interview. HR reported aggregate employee exit data for employees who separated in 2011 and 2012 in its 2013 annual report for its internal use; the aggregate data were provided to divisions only on request. For employees who separated in 2013, the aggregate employee exit data in HR's annual report were distributed to Board divisions in May 2014. The 2015 publication that will reflect 2014 aggregate employee exit data was being compiled at the time of our audit.
GAO's Diversity Management: Expert-Identified Leading Practices and Agency Examples suggests that one leading practice is to use quantitative and qualitative data derived from interviews, focus groups, and surveys to identify employee perceptions of the work environment and culture. Over time, trends in responses can help an organization assess progress in achieving organizational goals and objectives.
We noted that specific diversity and inclusion issues did not emerge in HR's annual reports; however, exit interview narratives documented that the most favorable aspects of working at the Board were colleagues, employee benefits, and work schedules. Interviewees indicated that the least favorable aspects included workload pressures, dissatisfaction with management, and frustration with having several layers of review of work and not being able to make decisions at lower levels of the organization. Board divisions can benefit from having access to agency-wide employee exit statistics and exit interview responses regardless of whether the division had employees who separated, as that information may help inform the Board's continued efforts related to diversity and inclusion.
- U.S. Government Accountability Office, Diversity Management: Expert-Identified Leading Practices and Agency Examples, GAO-05-90, January 14, 2005. Return to text
- The federal government average for separations was obtained from OPM's FedScope, which is a database that includes information on permanent employees who left the federal executive service (excluding the U.S. Postal Service). FedScope data are recorded on a fiscal-year basis; however, Board separation data are captured on a calendar-year basis. Therefore, an exact comparison could not be made. FedScope can be found at http://www.fedscope.opm.gov. Return to text